100% Employee Owned, Founded 1954
As a Cross calibration customer, you have free access to GageSuite, our comprehensive, user-friendly calibration management system. Beyond giving you instant access to the complete calibration and repair history for each piece of equipment, GageSuite now gives you drift charts for each piece of equipment. GageSuite uses real data from your calibration events to create charts showing your equipments’ drift trends over time.
To learn more about how the data found in your drift charts can help you improve your quality program check out our article: What is Drift Analysis and Why is it Important to Your Quality Program?
When our technicians complete a calibration service on your equipment they record the as-found-data for each test point. This means the reading the device gave when it was measuring a known quantity. For instance, if you were calibrating a scale and one of the test points was five pounds you would put a five pound test weight on the scale. The as-found would be the value the scale read. It may be exactly right (five pounds) or it could be slightly over or under. Even if the amount that it is over or under is within tolerance for the device, it is helpful to know if it is consistently being found to weigh a pound heavy or a pound light.
Our drift chart will show you the as-found-value for the test point with the highest deviation for your device at each calibration event. By tracking this over time you can then assess how well your equipment is performing between calibrations and adjust your calibration frequency accordingly.
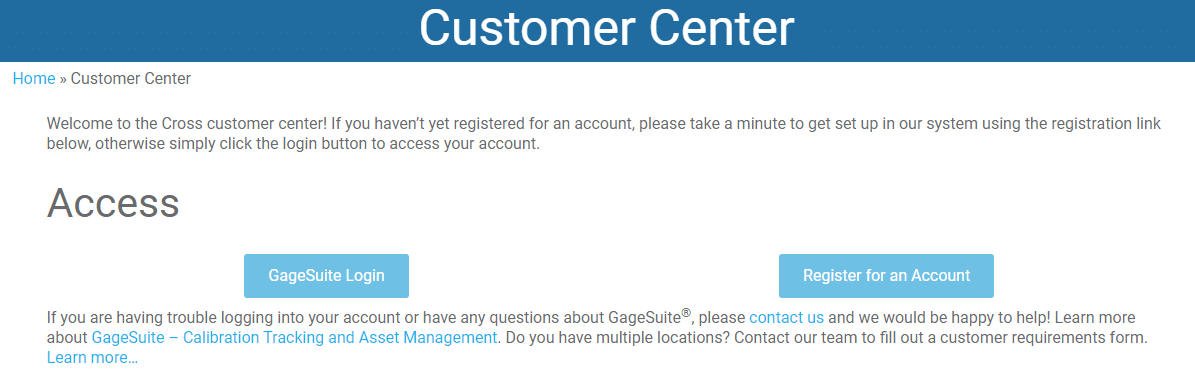
First you will log into GageSuite.
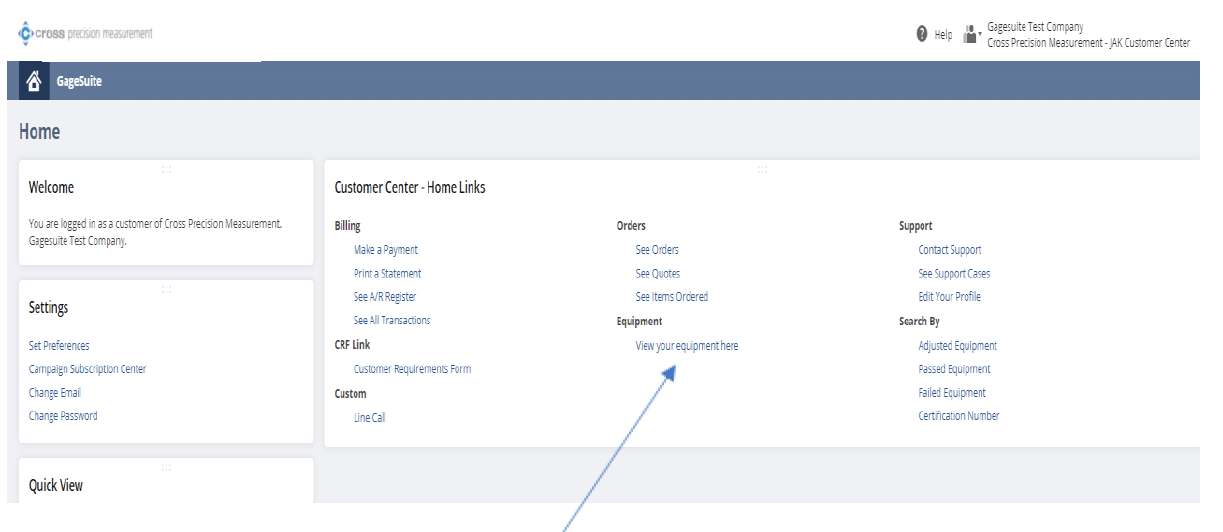
Once logged in you will go to “View Your Equipment”.
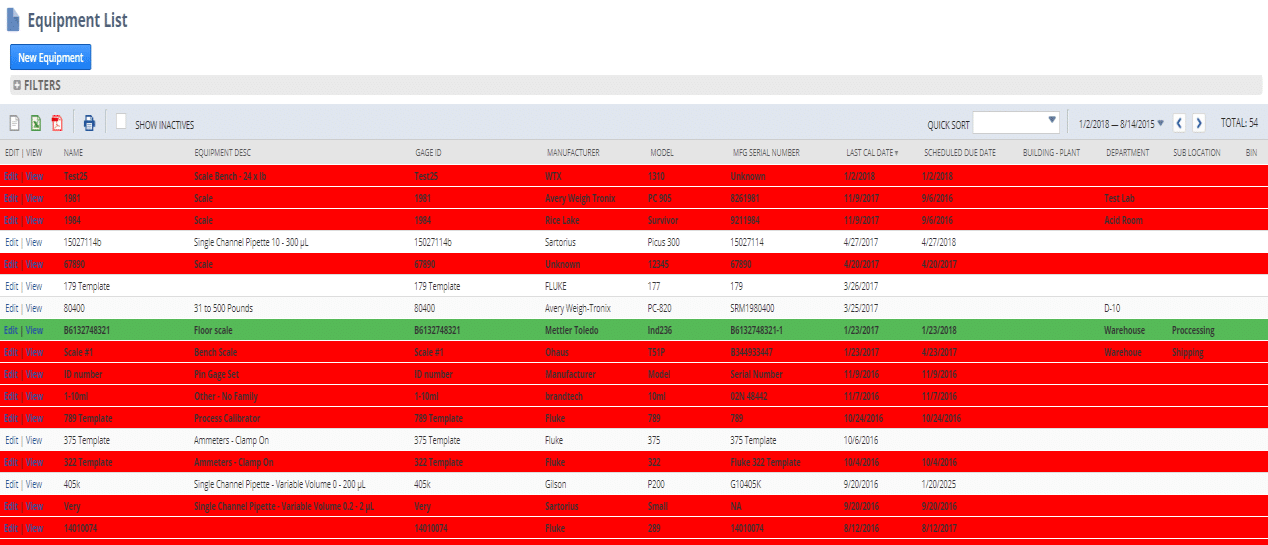
On the Equipment List page you will select the piece of equipment you’d like to look at.
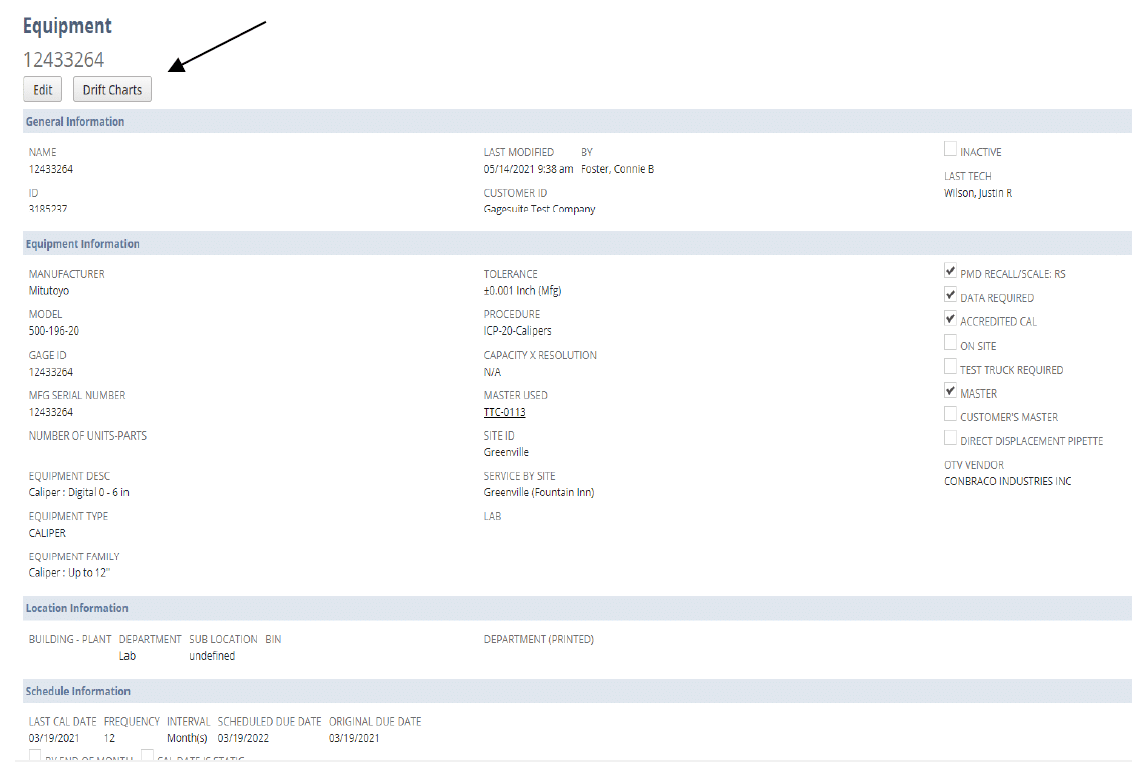
Once you are on the Equipment Record, you will click the “Drift Charts” button at the top.
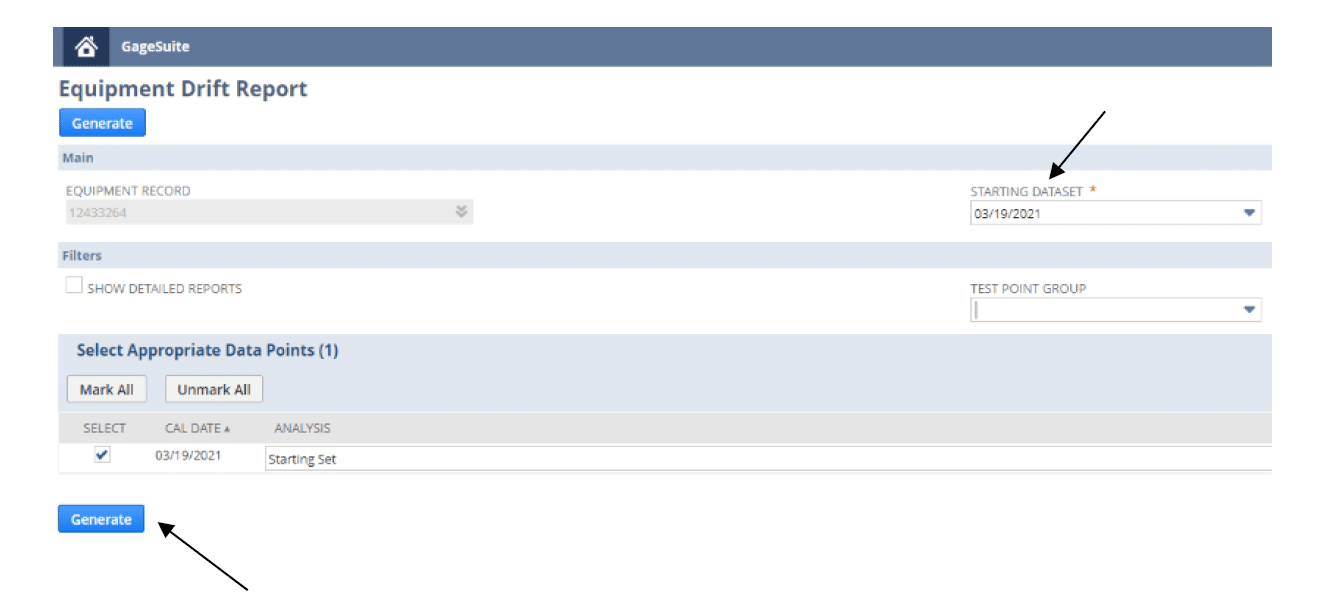
That will open the Equipment Drift Report page. Here will enter the starting date from which to pull the calibration event data. You will then click Generate at the bottom of the page.
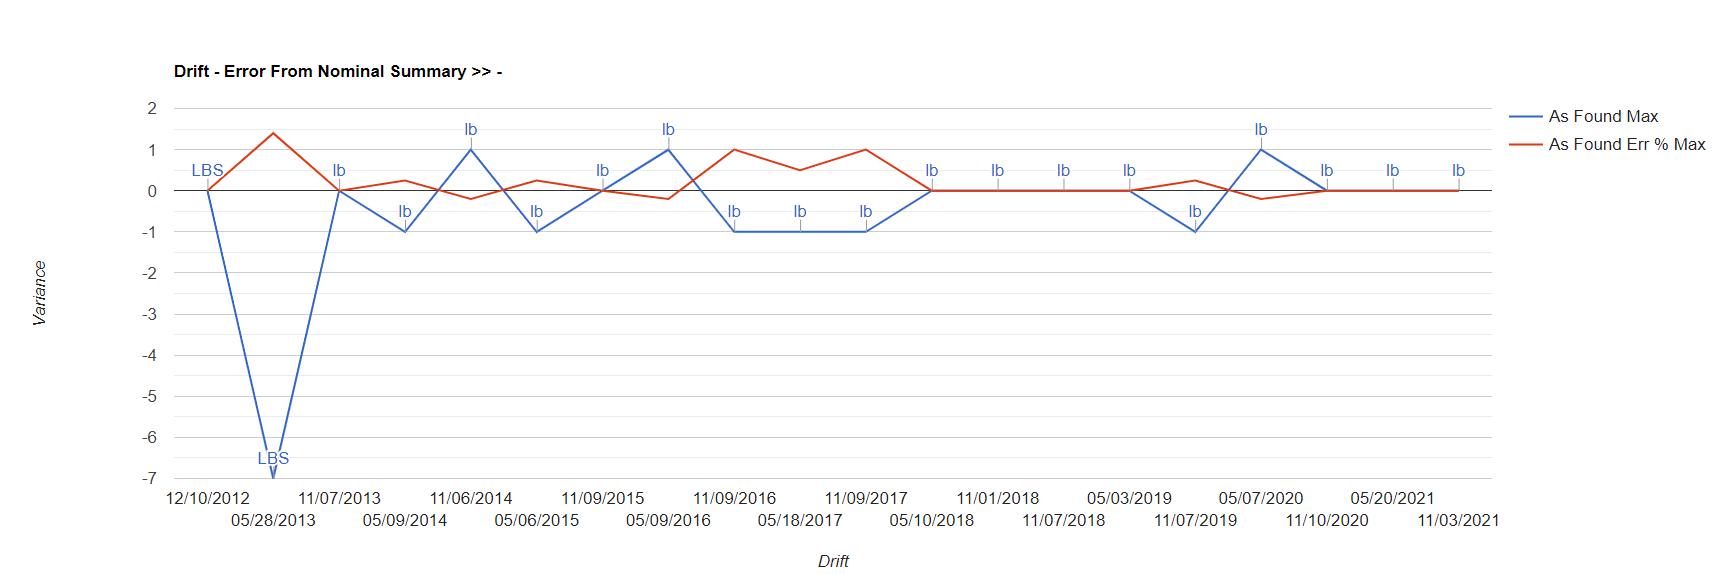
This will take you to a page with a drift chart that will look something like this:
We hope that this information will help you to make informed decisions about the calibration frequency of your equipment. If you don’t already have access to GageSuite, click here to register today. Contact us if you have any questions about drift analysis or GageSuite. Our precision measurement experts are here to help!
"*" indicates required fields
We’re looking through thousands of pages to find the most relevant information.
In the meantime, enjoy these fun facts…